The Stats Guy: What supermarket scanner data says about Australia


It's Australia v Germany in Simon Kuestenmacher's latest look at the stats. Image: TND
The Australian Bureau of Statistics (ABS) conducts the Household Expenditure Survey (HES) in somewhat irregular intervals of five to seven years.
For this wonderful survey 10,000 households are asked extremely detailed questions about their spending habits. This is an expensive survey to run but it gives us detailed information on the way we spend our money.
About 450 different spending categories are outlined and we know exactly how our spending habits on curtains (down 60 per cent), canned spaghetti (down 22 per cent), and women’s active wear (up 357 per cent!) changed over the last six years.
We also can spot a few quirky regional spending preferences. For example, in which capital city do folks spend the most money on wristwatches?
It’s neither the public servants of Canberra nor the bankers of Sydney who spend big on chronometers. The correct answer is Darwin. The business dress code up north foregoes suits in favour of polo shirts. Wristwatches are therefore the best way to signal your status and importance to the world around you.
The last HES was run in 2016, the previous one in 2010. Not a very timely way to measure changes in our spending habits. In our digital age there must be better (and cheaper) ways to gain insights into our shopping behaviour.
I previously wrote about how much of retail spending takes place online and how retail spending by broad category changed monthly. The ABS also uses supermarket scanner data to understand our shopping behaviour. This is a somewhat experimental dataset, but it tells some very interesting stories.
Let’s compare supermarket sales of the June 2021 quarter with the June 2019 quarter to see how our spending patterns might have changed due to COVID.
Overall supermarket sales went up 14 per cent over that time. That big increase in sales makes sense since in locked down cities supermarkets are the last remaining source of entertainment. Ah, the joys of the middle aisle at Aldi …
The first consumption change that we see is driven by geopolitical forces. Rock lobsters and crabs (+180 per cent), fish and squid (+100 per cent), as well as fish and molluscs (+35 per cent), and even oysters (+30 per cent) have seen the highest sales increases. We bought more seafood in 2021 because prices were much lower than usual.
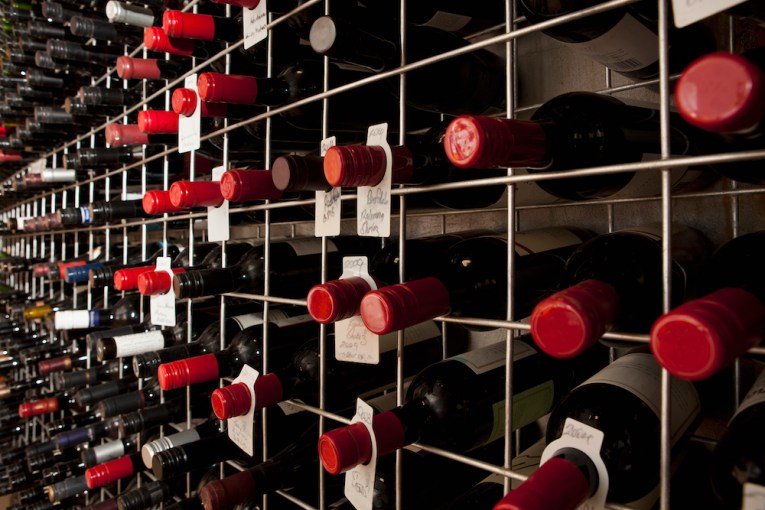
For the last year and a bit, China regularly tightened restrictions on Australian imports as a geopolitical powerplay. Coal, copper, wine, cotton, wood and, of course, lobster exports suffered. Our exporters lost billions of dollars, but local seafood prices plummeted. A silver lining so to speak.
During the pandemic we spent almost twice as much (+82 per cent) as usual on prepared meals. An understandable move considering many of us must handle home schooling and remote work at the same time. Might as well make dinner less of a hassle.
Other booming product categories appear simply to be the result of people not eating out as much now that lunches in the office and dinner dates with friends are, quite literally, off the table. Classic dinner favourites increased between 15 and 30 per cent: meat, poultry, vegetables, potatoes, cheese, dairy, oils.
Coffee sales grew by 14 per cent (perfectly average growth). I would’ve expected coffee sales to have gone up a bit more, considering how much more time we spend at home. Maybe the moderate increase can be explained by takeaway coffees. When the only law-abiding way of socialising is a walking date with a mate, takeaway coffees are the most convenient treat.
Below average increases in cereal (+11 per cent) and milk (+12 per cent) sales make perfect sense to me. The pandemic hasn’t changed our breakfast habits much, as the most important meal of the day was always consumed at home.
In net terms we even consumed less sugar (-1 per cent) and chocolate (-4 per cent) in 2021 compared to 2019. I’ll interpret this as a humble attempt to attack the COVID-kilos.
Bye bye lamb’s fry
We also spent significantly less on ice (-14 per cent). Since we can’t throw parties, we don’t need Eskies full of ice.
The single biggest loser is offal (the internal organs and entrails of a butchered animal). I’ll blame the 19 per cent decline partly on demographics. Millennials that have recently started cooking for their young families just don’t know how to cook with offal.
The supermarket scanner data is far from perfect. It would be helpful to have access to this data on a city-by-city basis rather than just on a national level. Due to different lockdown scenarios, we would expect differences in shopping behaviour.
That said, the dataset already complements the Household Expenditure Survey really well. It’d be great to see the ABS use more data from innovative sources like mobile phones or credit cards.
When we can identify trends faster, we can adjust policies quicker, and markets should run more efficiently too.