The stats say wages have grown, but here’s why the reality is different


Worker wages grew at their fastest annual pace in 15 years, lifting 4.2 per cent through to December from 4.1 per cent in the September print. Photo: Getty
Wages grew according to figures released in November, but they’re not likely to make anyone feel much richer.
The 1.3 per cent growth in wages for the September 2023 quarter represents the highest quarterly growth in the Wage Price Index’s 26-year history. And the annual growth figure of four per cent is the highest since March 2009.
This is great news for the government that took office on a promise to “get wages moving”, as Anthony Albanese has regularly promised since becoming Prime Minister, but does it actually mean that the average Aussie is now 4 per cent better off than they were last year?
No, it doesn’t.
Despite the statistical 4 per cent annual increase in wages from September 2022 to September 2023, real wages have actually fallen when adjusted for inflation because in that same period the all groups consumer price index has increased by 5.6 per cent.
That means that, at least on a statistical basis, a person receiving the average wage increase is, in fact, worse off in real terms. They haven’t gone forward by 4 per cent, they’ve gone backwards by 1.6 per cent.
But what if we took a longer-term view? How have wages performed versus the cost of goods over the past six years?
Rather than hold everyone in suspense, I’ll tell you now. The picture gets worse.
Working off the September figures for the sake of simplicity, wages from the period of September 2017 to September 2023, taking into account the most recent 4 per cent increase, have risen by 16.28 per cent. That works out at a figure of about 2.55 per cent per annum.
What about CPI over that time? That rose by 21.4 per cent for the same period, leaving people on average 5.12 per cent worse off now than they were in 2017.
And although that’s not exactly a good thing, it doesn’t seem to fully explain the cost-of-living crisis that most people are continuing to feel pinched by each time they head to the supermarket or fill up the car, but the following figures might help explain why.
For that same period, September 2017 to September 2023, prices for food and non-alcoholic beverages as measured by the ABS have risen 25.9 per cent.
Fruit and vegetables? 26.7 per cent.
Feeling like a loaf of bread or box of cereal is markedly pricier? You’re right, bread and cereal products have risen 31.3 per cent. Milk and other dairy products? Up 35.8 per cent between September 2017 and September 2023.
And the most painful of all for anyone who drives a car? Automotive fuel was up 64.1 per cent to the September 2023 quarter but has since retreated a little to be sitting at 58.5 per cent as at November 2023.
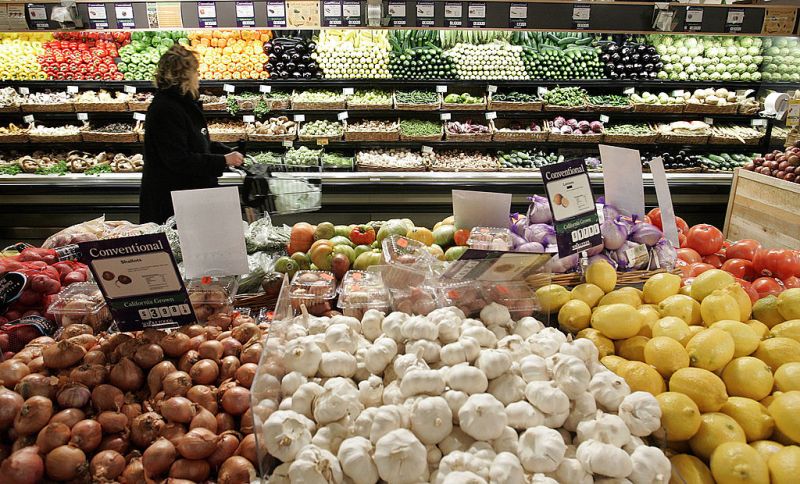
Fruit and vegetable prices have soared. Photo: Getty
The gap then, between what we were paying for everyday staples in 2017 compared to what we are paying now, taking into consideration average wage increases over that time, is wide and getting wider.
As long as wage growth – no matter how high – continues to be outpaced by inflation, we are, on average, worse off.
Has everyone shared the pain?
Not exactly. Keeping in mind that wages have risen at an average annual rate of about 2.55 per cent since September 2017, if we look at ABS business indicators data that records company gross operating profits (CGOP), it paints an interesting picture.
Again, sticking with September year-on-year figures, the ABS data shows that CGOP have averaged 10.6 per cent annually since September 2017.
Of course, these are average figures which mean that while some companies may have performed very well over that time, others have faced a market that was far more challenging.
In the construction industry for instance, CGOP has remained relatively flat over the past few years, having risen from $7.35 billion in September 2020 to $8.06 billion in September 2023. That represents a total increase of 9.6 per cent over the three-year period.
Even still, that number glosses over the fact that profits fell after September 2020 and have only truly recovered in the 2023 figures. On a graph it looks a little bit like the mouth of a smiley face.
And at that measure, the data reflects the challenges we have all seen play out over the past few years with some famous examples of well-known construction companies entering administration.
Don’t worry about miners, though – they’re doing OK
With many industries struggling over the past few years, it begs the question where the heavy lifting has been done to see profits still maintaining an annual average of 10.6 per cent.
One place we might look to find that is in the mining industry.
The ABS data tells us that in September 2020 mining industry CGOP was just shy of $35 billion. That figure rose to $58.47 billion in September 2021 and then to $67.48 billion in 2022 before dropping back to $54.87 billion in 2023, which still represents annual profits that were 56 per cent higher than they were in 2020.
Adjusted for inflation or not, those are some super profits.
Scott Riches is a former union official with the Electrical Trades Union Victorian branch, and a practising employment lawyer. He is also a volunteer in the employment clinic at the Fitzroy Legal Service