How the polls got it so wrong: explained
The New York Times predicted Ms Clinton would take Florida and Ohio. Photo: NYT
Two days ago, pollsters and statisticians gave Hillary Clinton odds of between 75 and 99 per cent of winning the US presidential election.
How did so many get it so wrong?
In hindsight, the polling consensus went astray in two major ways.
The media pumped out two kinds of poll story.
Some were national surveys designed to estimate the entire country’s popular vote, but not the outcome in individual states, where the contest is actually decided.
These polls actually got the big picture right: Ms Clinton won more overall votes than President-elect Donald Trump – but not by as much as the polling averages predicted, and not where she needed to.

None of the major news outlets predicted a Clinton loss. Photo: Getty
News organisations also produced a blizzard of stories meant to calculate the probability of victory for the two candidates.
These calculations were predicated on polls of individual states.
In hindsight, though, the stories seem to have overstated Ms Clinton’s chances for a win by failing to see that a shift in voting patterns in some states could show up in other, similar states.
In part, this is because polling analysts got the central metaphor wrong.
US presidents are chosen not by the national popular vote, but in the individual Electoral College contests in the 50 states and Washington DC.
In calculating probable outcomes, election predictors generally treated those 51 contests as completely separate events – as unrelated to one another as a series of 51 coin tosses.

A new First Family will soon enter the White House. Photo: Getty
But that’s not how elections work in the US.
Voting trends that appear in one state – such as a larger-than-expected Republican shift among rural voters – tend to show up in other states with similar demographic make-ups.
And that’s what happened on election day: the election models calculated the probabilities of a Clinton win that turned out to be high, because they viewed each state too much in isolation.
The Reuters/Ipsos States of the Nation project projected Ms Clinton to win the popular vote 45 per cent to 42 per cent for Mr Trump, and gave her a 90 per cent probability of winning the 270 electoral votes needed to secure the election.
In the end, Ms Clinton won the popular vote by 47.7 per cent to 47.5 per cent, by the latest count, and Trump could win the electoral college by as many as 303 votes to Clinton’s 233.
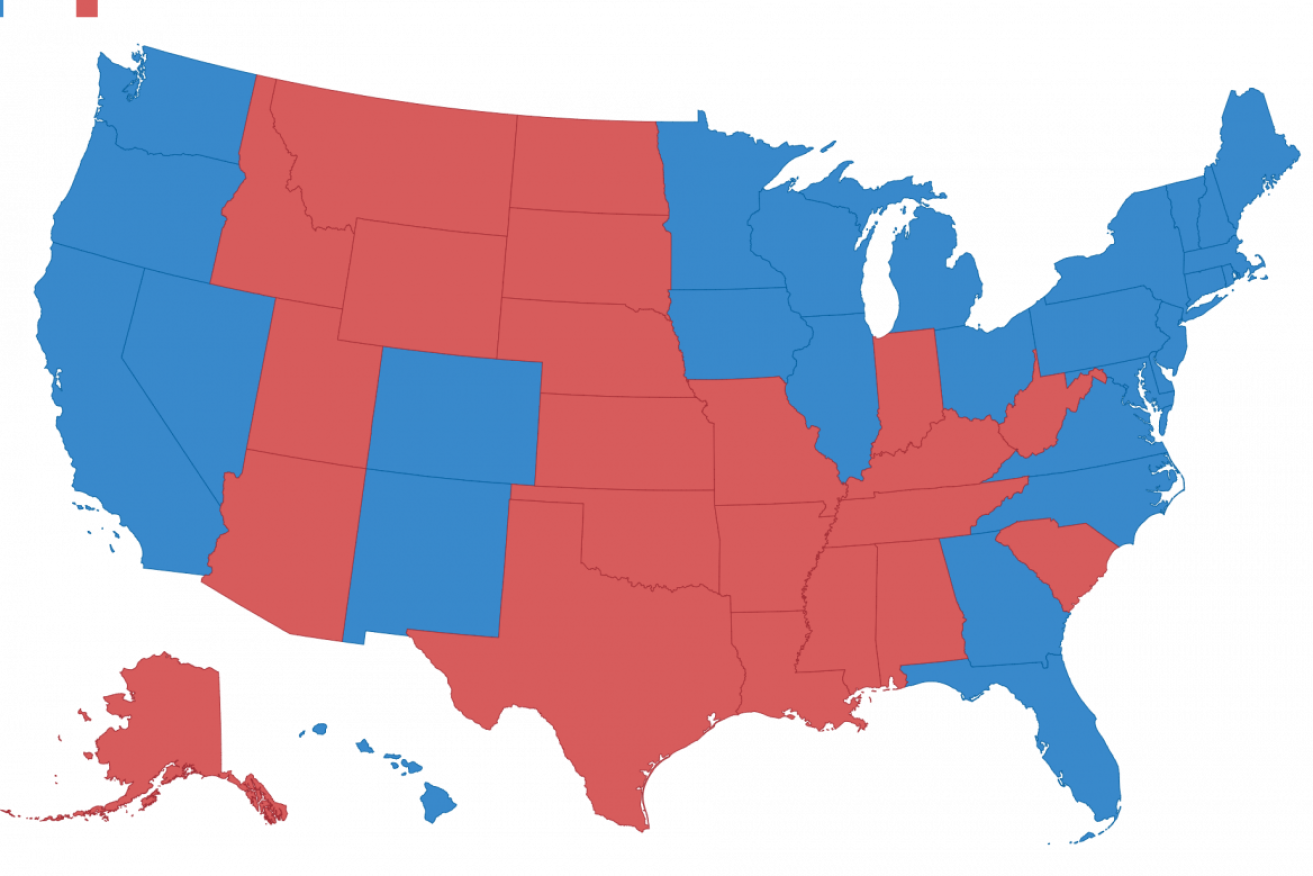
How Donald Trump reshaped the election map https://t.co/MikB4bAPNo pic.twitter.com/ecJbnlUPj0
— The New York Times (@nytimes) November 9, 2016
The state races were not akin to a string of coin tosses, but more like 51 rolls of a set of weighted dice. In many states, it turned out, the side of the dice representing white voters in suburban and rural counties carried a heavier weight, and the side representing urbanites a lighter one.
Cliff Young, president of Ipsos Public Affairs US, the polling partner of Reuters, said the problem came down to the models the pollsters used to predict who would vote – the so-called likely voters.
The models almost universally miscalculated how turnout was distributed among different demographic groups, Young said.
And turnout was lower than expected, a result that generally favours Republican candidates.
This year, “whites with lower levels of education came out in greater relative numbers than younger, more-educated and minority voters,” Young said.
“A point here or a point there can really change an election.”
-AAP

Legal rule stops even Hugh Grant from a win in court


Thousands flee Indonesian volcano