What’s really going on in the property market
An 'easing' market could be the Goldilocks scenario for everyone. Photo: Getty
The Reserve Bank and prudential regulator APRA seem to be cooling the property market, which is potentially good news for affordability and the nation’s financial stability.
RBA governor Philip Lowe told a parliamentary hearing on Thursday he was feeling “a bit more comfortable” because the “current cyclical position is better than it was a year ago”.

Philip Lowe is both optimistic of averting a bubble, and concerned about affordability. Photo: AAP
He was echoing the minutes of the RBA’s most recent board meeting, released on Tuesday, where the central bank said the market had “eased”.
But Dr Lowe also admitted the “stunning rise” in prices worries him deeply because he is a father of three children.
In this concern he was joined by Labor shadow treasurer Chris Bowen, who in a speech on Thursday warned that unaffordability is at “crisis levels”.
Here’s why the latest data seems to support the Reserve Bank’s optimism, and may even give hope to young Australians fearing they’ll be locked out forever.
A cooling market
The Reserve Bank noted that price growth “declined” at the national level and across most capital cities over the past year. Prices didn’t fall, they simply grew slower.
This might relieve fears of a bubble burst. An ‘easing’ is preferable to a drastic correction. And the “strong upswing” in supply noted by the RBA is a signal that residential property will continue to prop up GDP.

Labor’s Chris Bowen says prices are at “crisis levels”. Photo: Getty
The story of the ‘bubble’ in the property market is often plotted from late 2011, when the RBA renewed its campaign of cash rate cuts.
The average price of residential dwellings grew nationally from $490,800 in the third quarter of 2011 to $623,000 in the second quarter of 2016, an overall increase of 27 per cent, with the strongest growth in NSW (48 per cent), Victoria (26 per cent), South Australia (14 per cent) and Queensland (12 per cent), according to ABS data published on Tuesday.
The total value of the nation’s dwelling stock grew from $4.4 trillion to $6 trillion over this period.
But … dwelling stock values grew only 4.8 per cent from Q2 2015 to Q2 2016, compared to 12 per cent in the 12 months before that, and 9.5 per cent before that, according to the ABS.
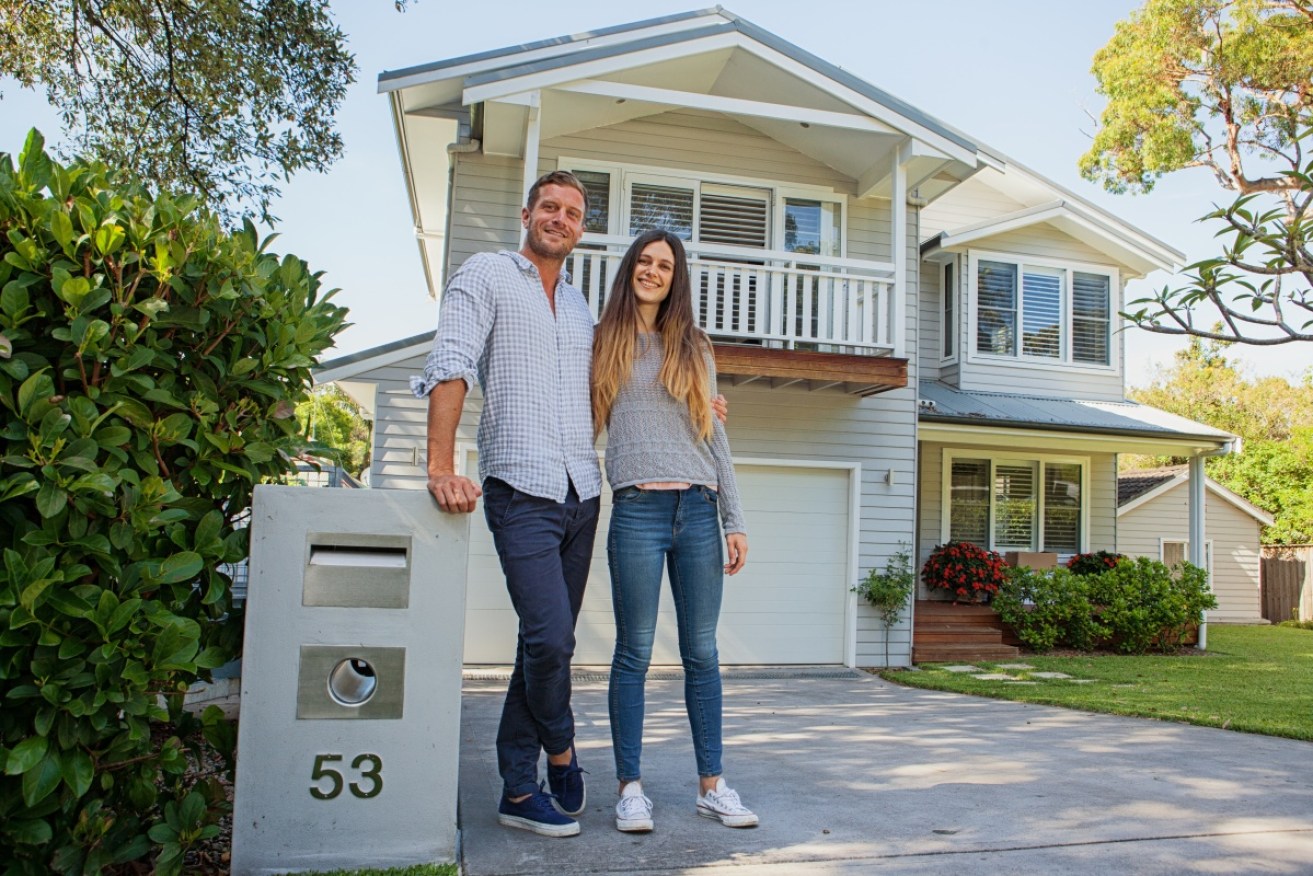
First homebuyers will hope this trend continues.
Why? Well, the ABS’ favoured affordability measure is house price-to-income ratio. It hasn’t updated the official figure since 2015, but economist Callam Pickering has estimated that prices are now 130 per cent of income, the worst since the 1990s.

Source: Corelogic / ABS / RBA / APM / RESIDEX
Apartment bargains galore
The RBA noted there was a “considerable volume” of apartments scheduled to be completed in coming years, especially in the eastern states.

The ‘glut’ of supply is pushing down apartment price growth. Photo: Getty
Prudential regulator APRA is also enforcing more stringent lending guidelines. These two factors are likely to dampen prices, especially in the apartment markets of Melbourne and Sydney.
The unit price index (which includes apartments, units and flats) held steady at around 126 per cent in the last 12 months, compared to an 810 basis point increase in the previous 12 months, and 730 points the 12 months before that.
Insurance firm QBE has forecast that unit prices will fall modestly in all capital cities except Brisbane until 2018.

Source: CoreLogic/ABS
Bad news for investors
The cooling market will probably annoy investors, developers and real estate agents.

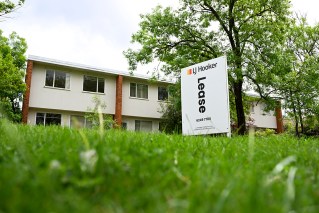
Rental vacancies are up. Photo: Getty
The number of vacant rental properties is rising nationally and is expected to trend upwards in coming years. And rental yields are the weakest in more than two decades, especially in Sydney and Melbourne, according to CoreLogic.
And as the RBA noted, the aggregate rental vacancy rate “drifted higher and was close to its long-run average”, and the number of auctions and private treaty sales are down compared to the previous 12 months.
Property loans are down as well. Between July 2015 and July 2016, the total value of housing credit (which includes loans to owner-occupiers to buy family homes and to rental investors) shrank by 17 per cent, according to the ABS.

Source: CoreLogic
A disconnected market
Sydney, Melbourne and South Australia have driven national growth, and are widely expected to be subdued in coming years.

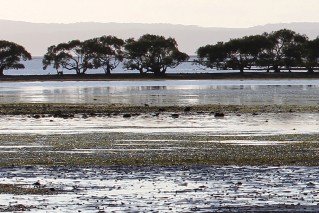
Brisbane could be the next growth city. Photo: Getty
Western Australia and the Northern Territory have been pulling down the national average because of the end of the commodities boom.
Darwin has been losing ground since 2014. It reached a high in the price index of 114.7 per cent in Q2 2014 before falling 940 basis points to 105.3 per cent in Q2 2016. Over the same period, the average price across the Northern Territory fell from $529,200 to $481,500.
The price index in Perth fell from 114.8 per cent of the base year in Q2 2014 to 108 per cent in Q2 2016. Average prices across Western Australia fell from $594,600 (Q2 2014) to $546,200 (Q2 2016) – an 8 per cent drop.
Brisbane’s growth has been steady, and some predict it will outstrip Sydney and Melbourne. Its price index grew from 100.8 per cent (Q3 2012) to 118.6 per cent (Q2 2016). The average Queensland price rose from $426,300 (Q3 2012) to $480,900 in Q3 2015, but corrected to $479,700 this year.
Hint of a bigger plunge?
The fall in existing dwelling sales is perhaps most surprising.
Between Q2 2015 and Q2 2016, the total number of transfers of established dwellings (houses, units, apartments and flats) fell -32 per cent in VIC, -32 per cent in QLD, -20 per cent in the ACT, -17 per cent in NSW, -17 per cent in TAS, -17 per cent in NT, -13 per cent in WA and -4 per cent in SA.
This could be an anomaly. The numbers might be revised down by the ABS after publication, as often happens.
But if accurate, it is further proof of cooling – and a hint of even slower growth in future.