Is the Coalition as good at managing the economy as it claims?
During the federal election campaign, the Liberal Party released an image on Twitter depicting Scott Morrison as Obi-Wan Kenobi along with the phrase, “The economy is strong with this one”.
Aside from irking Star Wars diehards, the tweet highlighted a key theme of the Morrison government’s re-election sales pitch: Vote for the Coalition and Australia’s record-breaking economic expansion will continue.
The boom, now in its 28th year, is not over.
Tweet from @LiberalAus
But troubling signs are emerging.
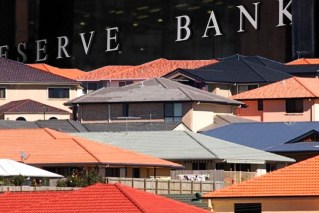
The Reserve Bank has cut the official interest rate twice (in June and July) to a record low in response to slowing growth.
But just how bad things are right now is subject to debate.
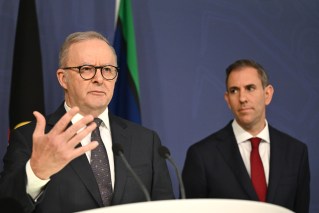
Treasurer Josh Frydenberg recently told Parliament that “the fundamentals of the Australian economy are strong”, while Labor says the economy is “floundering”, with economic activity being tamped down by stagnant wages, cost-of-living pressures and flagging productivity growth.
According to Shadow Treasurer Jim Chalmers: “Economic growth hasn’t been this slow [in the] 10 years since the Global Financial Crisis.”
Tweet from @JEChalmers
Australia was one of a tiny handful of countries that weathered the storm, notching positive annual growth throughout.
But how is it placed now? Is Dr Chalmers correct?
Made to measure
There are, of course, several ways to carve up the National Accounts, the official figures that chart Australia’s economic health.
As AMP Capital chief economist Shane Oliver puts it: “The numbers around the National Accounts present a lot of latitude for people to focus on their particular angle.”
The most closely watched measure of economic growth – and, indeed, the measure that the Bureau of Statistics publishes as its headline figure – is the chain volume estimate of Gross Domestic Product.
This provides a “real” estimate of the volume of goods and services produced across the economy, removing the impact of price movements (inflation).
The data is almost always expressed in either “trend” terms – using rolling averages to smooth out statistical volatility – or “seasonally adjusted” terms – a measure that seeks to iron out predictable seasonal fluctuations.
It is also most commonly expressed either in annual terms – comparing a particular quarter with the corresponding quarter of the previous year – or as movements from one quarter to the next.
There is no consensus about which is the more useful representation of economic growth (different measures tend to serve different purposes).
But if you are trying to get a handle on how the economy is tracking at a particular point in time, it’s probably most instructive to use the annual (year on year) seasonally adjusted figures.
The quarterly figures tend to be more volatile, while the trend figures represent an average and, as such, are less representative of what is happening now.
John Edwards, a senior fellow at the Lowy Institute and an adjunct professor with the John Curtin Institute of Public Policy at Curtin University, said the annual, seasonally adjusted figures provided “the best picture” of what is happening with growth.
“The trend data, by definition, does not tell you what actually happened in the quarter or the year – it is intended more to guide expectations about the future by essentially averaging data.”
Taking the pulse
Which brings us to the question of how the Australian economy is tracking.
The latest figures show it grew 1.81 per cent over the year to the March quarter in seasonally adjusted terms.
You have to go back to the September quarter of 2009, when the economy was still being buffeted by the aftershocks of the GFC, to find a lower rate.
This is consistent with Dr Chalmers’ claim.
This is not, of course, the only way to measure growth. The quarterly figures, which tend to be more volatile, tell a slightly different story.
In seasonally adjusted terms, growth actually improved slightly in the March quarter, rising to 0.4 per cent from 0.2 per cent in the December quarter.
In fact, there have been a number of quarters since the GFC where quarterly growth has been lower than its current rate.
Per capita recession?
Some commentators have also claimed that Australia is now in a “per capita recession“, having notched three consecutive quarters of negative growth in GDP per capita.
The concept of a “per capita recession” is not widespread.
A recession, more broadly, is sometimes defined as a period of at least two quarters of negative economic growth.
Nevertheless, in quarterly, seasonally adjusted terms, GDP per capita shrank by 0.13 per cent in the September quarter of 2018, by 0.18 per cent in the December quarter and by 0.03 per cent in the March quarter.
And over the year, GDP per capita grew by just 0.11 per cent – its slowest pace since September 2009.
Again, this is consistent with Dr Chalmers’ claim.
But the debate doesn’t end here.
Mr Frydenberg says he prefers the bureau’s measure of “real net national disposable income per capita” over the GDP per capita measure. This, he says, provides a more comprehensive measure of living standards.
“Real net national disposable income is a much more comprehensive indicator of living standards than GDP per capita as it measures the amount of real income available for Australian residents to spend or save,” he said.
On this measure, Australia appears to be faring better, with real net national disposable income per capita up 1.3 per cent over the year to the end of March.
But this followed a period of negative or very low growth between the September quarter of 2012 and the March quarter of 2016.
As Dr Oliver pointed out, this measure can be heavily influenced by movements in commodity prices.
“That measure is distorted as well – we get a bit of good luck, the iron ore price goes up, and it looks like we are going fantastically well, but most people don’t get paid in iron ore, they get paid [a] salary,” he said.
The bottom line
There are several ways to carve up the data.
And, clearly, the economic situation confronting Australia today is not as serious as it was during the GFC. At least, not yet.
On balance, however, RMIT ABC Fact Check found Dr Chalmers had made a fair call in claiming that economic growth was at its lowest since the GFC.
The economy may still be growing, but whether it is “strong” is open to question.
Moreover, the outlook remains uncertain, particularly in view of the recent stockmarket turmoil triggered by escalating tensions between the US and China.
As the Jedi master Yoda put it: “Difficult to see. Always in motion is the future.”
–ABC
Want to see more stories from The New Daily in your Google search results?
- Click here to set The New Daily as a preferred source.
- Tick the box next to "The New Daily". That's it.

Reasons to be hopeful amid economic gloom

Jobless fall leaves door open to more rate hikes

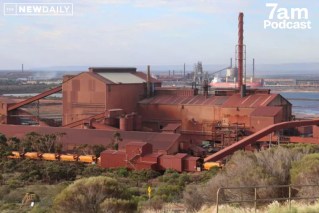
The billionaire who failed Whyalla steelworks
Carveouts for business after budget backlash