The Stats Guy: Mappy Christmas! 10 festive and silly maps teach us about Christmas

A journey through the festive season in silly graphics with our statistics guru Simon Kuestenmacher. Photo: TND
The most wonderful time of the year is upon us.
I know you are busy so I will try to keep this one short and tell you all you need to know about Christmas in 10 somewhat random and rather silly maps and charts. Ho ho ho, enjoy the ride. Mappy Christmas to you all!
First Christmas travel
Let’s start with the original, the first Christmas. As a demographer I love that Christmas involves a census. Joseph was called to return to his town of birth to be counted. The map below shows the likely journey and estimates a total hiking time (one way) of almost 28 hours. Commonly it’s assumed that the journey would’ve taken Joseph, Mary, and unborn Baby Jesus about four days. Our Australian Census in 2021 was certainly less cumbersome.
 Source: Eric Wagner
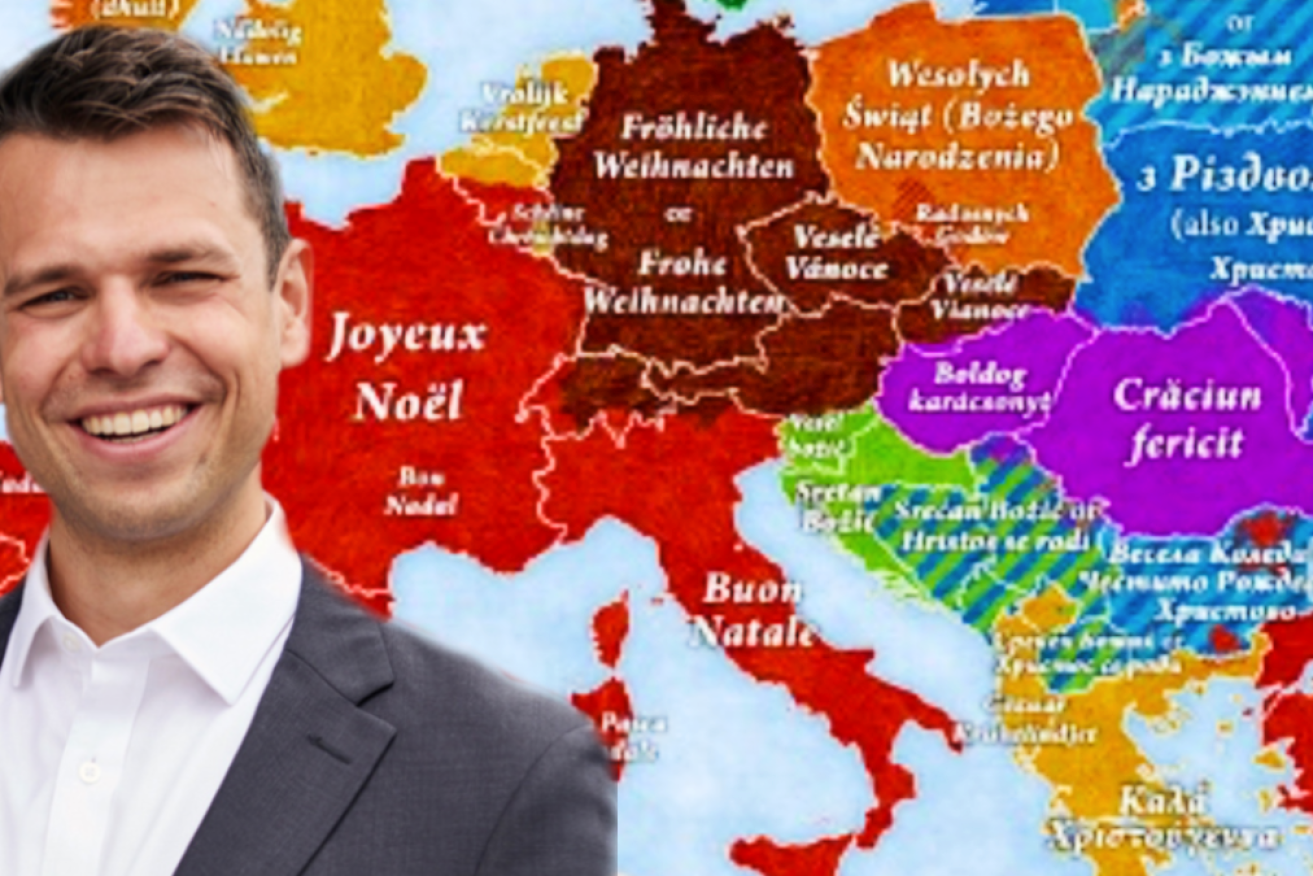
Merry Christmas in different languages
How do you wish your European friends a Merry Christmas? Nobody is more efficient than our mates in Norway and Sweden who manage to wish us well in only six letters – much more efficient than the Germans who need at least 16 letters.
 Source: Jakub Marian
Christmas gift-bringers across Europe
Who delivers our Christmas presents (besides Jeff Bezos)? In some countries there are competing traditions. Germans, for example, either believe in Santa Claus or the Christkind (Christ Child), hence the colour gradient on the map. And the whole of Europe is colourfully diverse in this regard. In the Soviet Union, Grandfather Frost brought the presents.
This custom has been preserved in many countries of the former Eastern Bloc, but at the same time Christian traditions are making a comeback, with St Nicholas or Baby Jesus as gift-bringers. In Spain, gifts are traditionally delivered by the Three Wise Men on January 5th or 6th. But thanks to the ubiquity of the ‘American’ Santa Claus, some Spaniards now receive their gifts from ‘Papá Noel’ on Christmas Eve.
 Source: Jakub Marian
Christmas song in data
This is a charmingly silly take on the classic Christmas carol The Twelve Days of Christmas. I must admit that I needed to look at the chart twice before I realised what’s going on here. Hope you think of this chart the next time you sing the song!
 Source: Neil R Kaye
Likelihood of White Christmas
Ok, here in Australia hoping for a White Christmas really is hoping for a Christmas miracle. In Europe snow at Christmas is obviously much more likely. This map shows the historical likelihood of experiencing a wonderfully clichéd Christmas. Clear geographic patterns are visible. Germany at the centre of Europe is slowly but surely transitioning into a no-snow-at-Christmas country.
 Source: Dominic Royé
Mathematically-correct Christmas cookies
Let me tell you about an unsung Christmas hero. The good man wants us to save time when baking our Christmas cookies. Martin Lersch, a Norwegian chemist, wants to make best possible use of the dough without having to collect all the in-betweens and knead it together and roll out again.
Since common holiday cookie shapes don’t typically fit together very neatly, our Norwegian friend created a tessellated tree cookie shape. Tessellations are geometric shapes that fit together perfectly and a tessellated cookie cutter allow us to minimise any re-kneading in the kitchen. Please don’t look down on your current batch of non-tessellated cookies though …
 Source: Atlas Obscura
Origin of US Christmas trees
I know hardly any Australians who are putting up a real Christmas tree. Reusable plastic ones or stylised trees appear to be the fashion here. In the US real ones are still the norm. This map shows where US Christmas trees come from. For all I know you could be in the US right now. If so, let me know where your tree is from – fair chance your tree travelled across quite a few states before arriving at your house.
 Source: American Geographical Society
Christmas treats map
The most important aspect of Christmas in my simple mind is the food. Sure, family is important too, but boy do I like a good Franconian Lebkuchen (that gingerbread for those who lack a rootin’ Teuton heritage). The good folks at the Taste Atlas put together a map showing the most delicious European Christmas treats. My estimate is that you can easily buy about half of them at your local deli, supermarket or shopping strip. There isn’t a more fun way to show the cultural diversity of Australia than to see how easy it is to get great international food.
 Source: Taste Atlas
The most dominant Christmas characters
Here is a simple game to create some conflict at your family Christmas gathering. Where do you, where do your relatives fall in the matrix below? I’ve been raised in a family that claimed it was better to lose a good friend than to waste a bad joke, so excuse my enthusiasm on this …
 Source: unknown (was emailed to me without a source)
December in review
Let me end this little collection of Christmas charts and data with a cute and uncomfortably relatable piece by Matt Shirley. I hope that your 2021 was more productive than the tongue-in-cheek chart suggests.
 Source: Matt Shirley
Merry Christmas and a happy 2022!


Record sales for Swift album, but not all on song

Dumped trash, trolleys top suburban eyesores


Bluey surprises again amid fears of ending