This is how much the average Aussie household earns

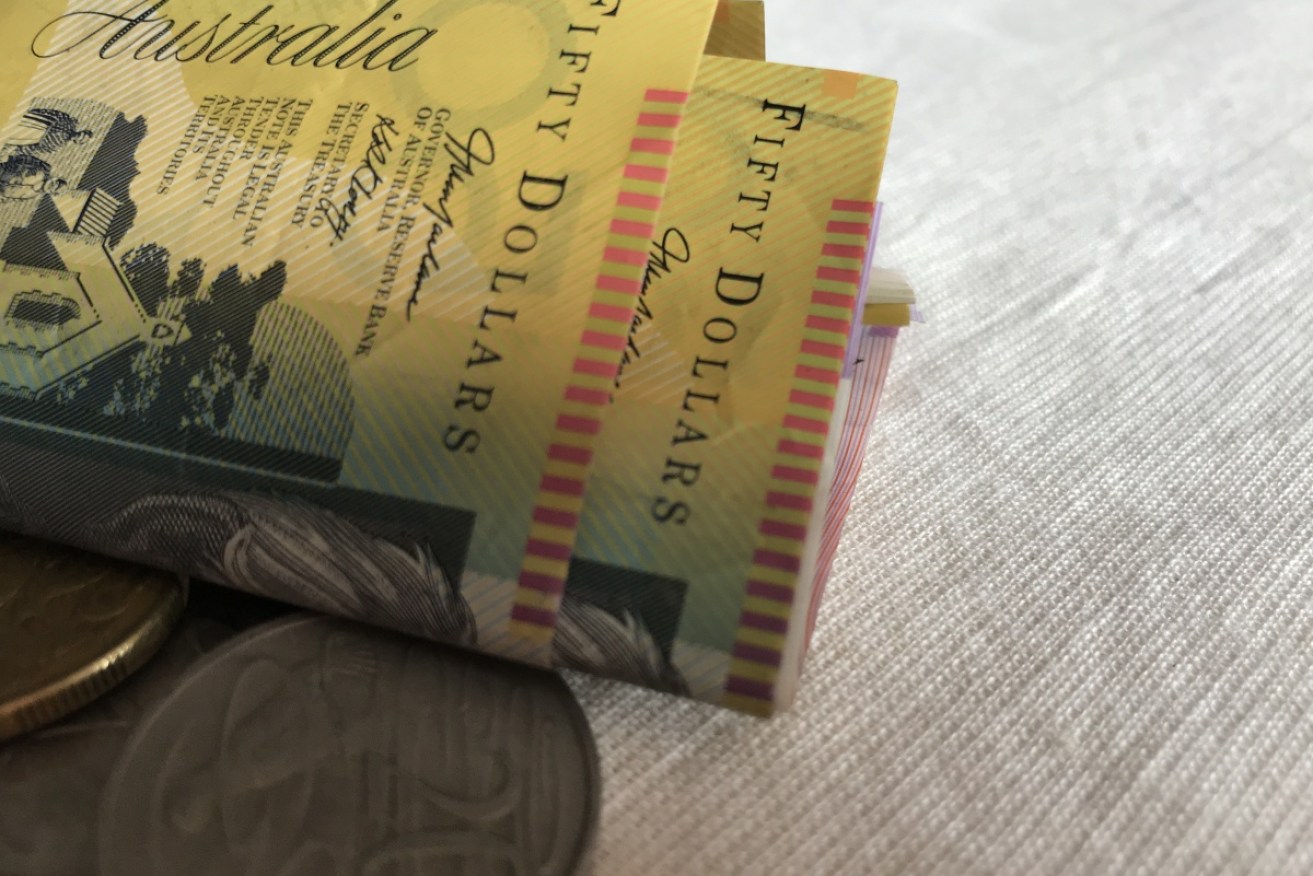
The average Australian household has around half a million in wealth. Photo: Getty
Does your household earn around $1800 a week after tax? Do you have around $500,000 in property, superannuation and other assets?
If so, you’re a member of an illustrious club: The average Australian household.
If you have less than that, you are, to put it crudely, on the poor side. If you have more, you’re on the rich side.
On Tuesday, the Australian Council of Social Service and the University of New South Wales released its latest Inequality in Australia report.
The purpose of the report is to reveal the level of income and wealth inequality in Australia, and put it in the wider context of wealth inequality around the world.
It found household income of around $4000 a week after tax, and $4 million in property, superannuation and other assets, would put you in the top 20 per cent of households.
At the end of the scale, a weekly after-tax income of $735 a week and wealth of around $30,000 puts you in the bottom 20 per cent.

The results of this year’s survey, which uses vast amounts of Australian Bureau of Statistics data from 2015-16, had both positive and negative aspects.
On the positive side, Australia’s wealth inequality – wealth being the value of assets like property, super and shares – was just below the average of the OECD nations (though above the median).
Another positive was that income inequality had plateaued in the years since the 2008 global financial crisis, after increasing rapidly before the crisis.
But income inequality in Australia was still worse than the OECD average – we were 25th of 36 nations.
Wealth inequality
In 2016, the net wealth – that is, total assets, including the superannuation and the family home, minus total debts – of the average Australian household was $936,000.
If that sounds like a lot, that’s because it is the mean, not the median, and is therefore skewed towards the upper end.
Unfortunately ACOSS and UNSW did not provide the median. However, the mean for the middle 20 per cent of Australian households – a more representative figure – was much lower, at $570,000.
In dollar terms, the gap between the richest and the poorest was massive.
With net wealth of $2.9 million, the wealthiest 20 per cent of Australian households (that’s around two million households) were almost 100 times wealthier than the poorest 20 per cent, who had on average just $30,000.
The wealthiest 5 per cent were 200 times wealthier, and the wealthiest 1 per cent 466 times wealthier than the poorest 20 per cent.

Source: ACOSS, UNSW
On average, 9 per cent of wealth was in owner-occupied housing, 20 per cent was in superannuation assets, 19 per cent was in shares and other financial assets, 12 per cent was in investment real estate, and 10 per cent was in non-financial assets, such as cars.
Income inequality
The New Daily recently ran a story looking at how much the average taxpayer earned a year – finding the median wage, before tax, was around $55,000 a year.
ACOSS and UNSW looked at a very different measure: After-tax household income, rather than before tax. That could be the total income of a family of two working parents and five children, an unemployed single mother with three children living on welfare, a 31-year-old working woman living alone, or an 81-year-old widower on the age pension.
The discrepancies in incomes between the highest and lowest-earning households were less dramatic than the discrepancies in wealth.
With an income of $3978 a week, the top 20 per cent of households earned five times as much as the average bottom 20 per cent, who earned just $735 a week.
The highest 5 per cent, on $6063 a week, earned eight times the disposable income of the lowest 20 per cent.
Unsurprisingly, those on lower incomes were much more likely to be reliant on the age pension or Newstart Allowance.

Source: ACOSS, UNSW
ACOSS chief executive Dr Cassandra Goldie said in recent decades inequality in Australia had worsened during economic booms and flattened when the economy has been slower.
But she said Australians should not accept increased inequality as an inevitable byproduct of growth, as increased social security payments and fewer tax loopholes for the rich could help bridge the gap.
“Unfortunately, the recently legislated income tax cuts, and a lack of action to lift the lowest social security payments including Newstart Allowance, both take us in the wrong direction,” Dr Goldie said.
“Once income growth is restored, we can expect inequality to rise further unless governments, business, unions and communities actively work together to prevent this.”
–with AAP


PM upbeat about Senate OK for tax-cut package